
No, of course not. Not in november, december and january. But outside this period you’ll get plenty of rays so you can power your household. Divín lies 48° 27′ 2″ north, similar to e.g. Vienna or Munich. So days are quite long in the summer and not super short in the winter. Also weather is nice throughout the year apart from those three dark months when you also sometimes get fog, inversions, and smog.
It’s been 3 years since we started operating solar power plant on our roof and I would like give you some numbers of how much electricity can such plant produce a year. In the visualisation below you can see that in 11/2021-10/2022 it produced 3.69 MWh, in 11/2022-10/2023 it was 3.31 MWh and in 11/2023-10/2024 it was 3.52 MWh (purple line in the plot and green numbers in the report). The visualisation is from Shelly application and the numbers are measured by Shelly 3EM smart electricity meter.
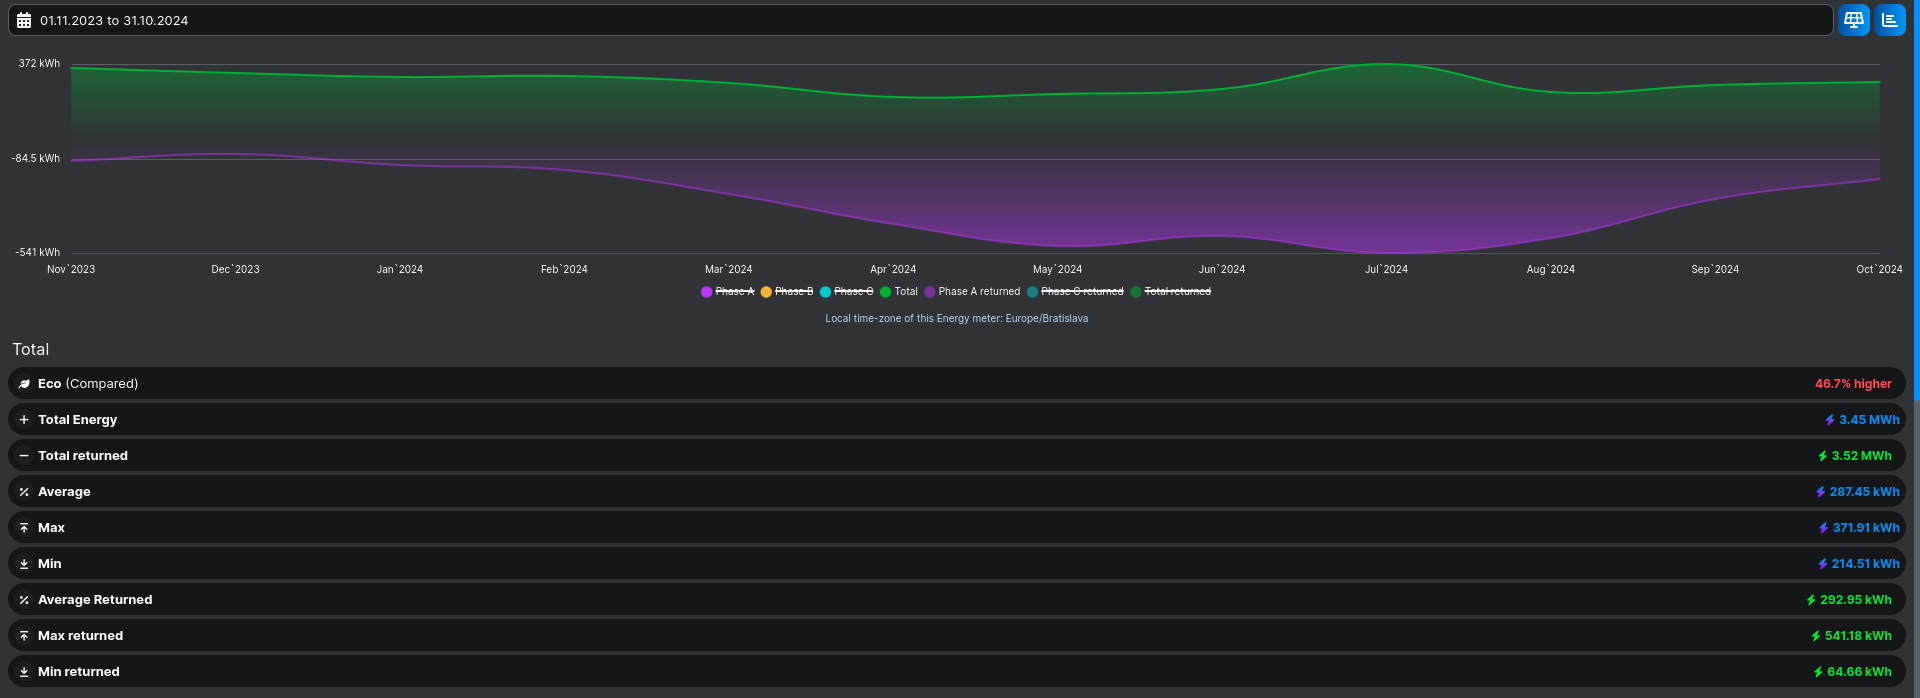
2023/2024
purple line = PV production
green line = house consumption
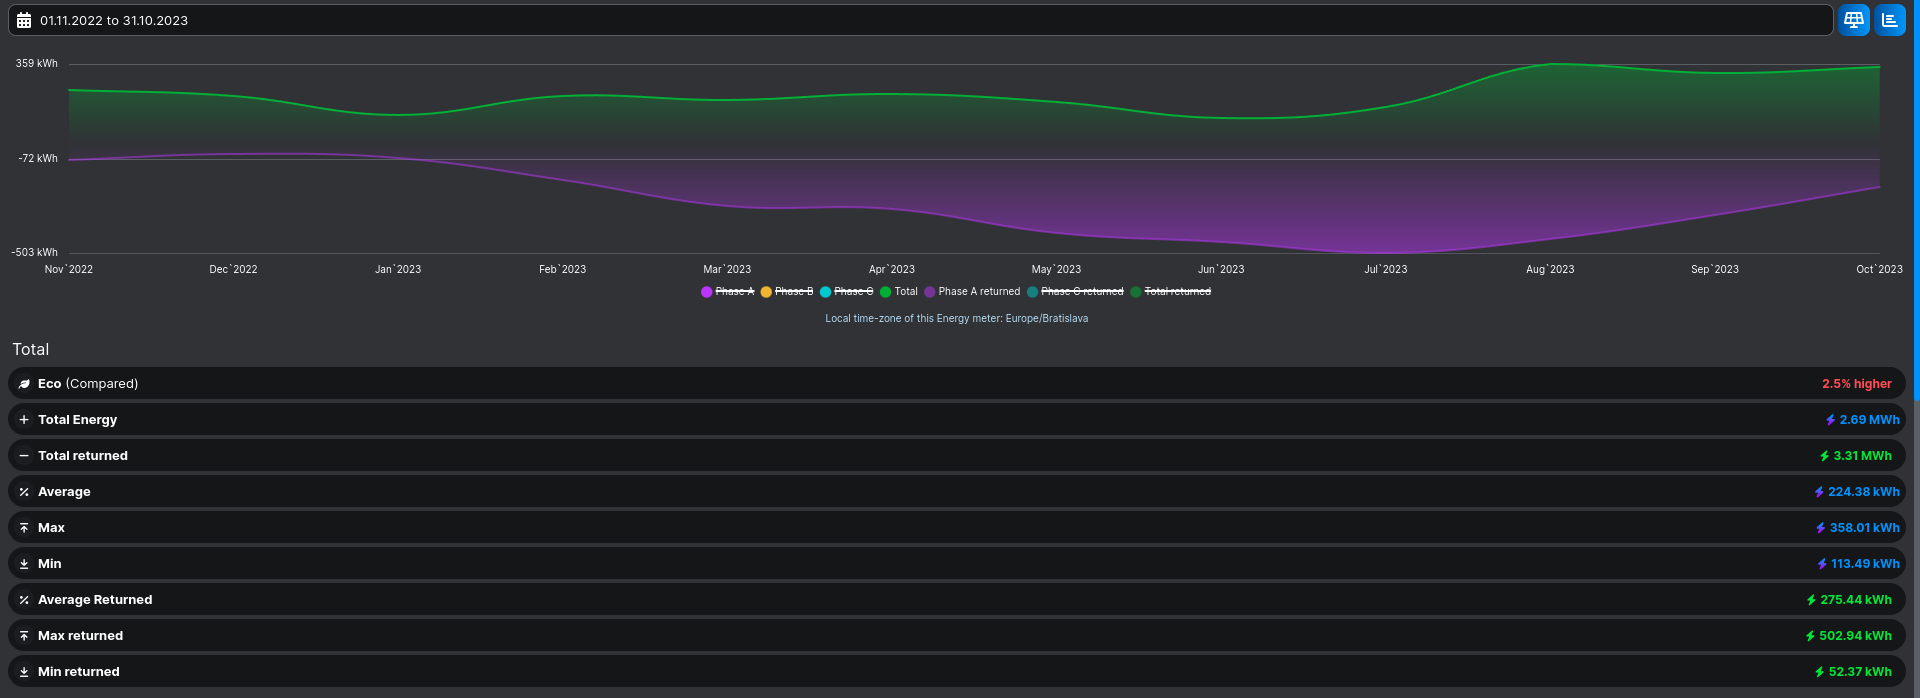
2022/2023
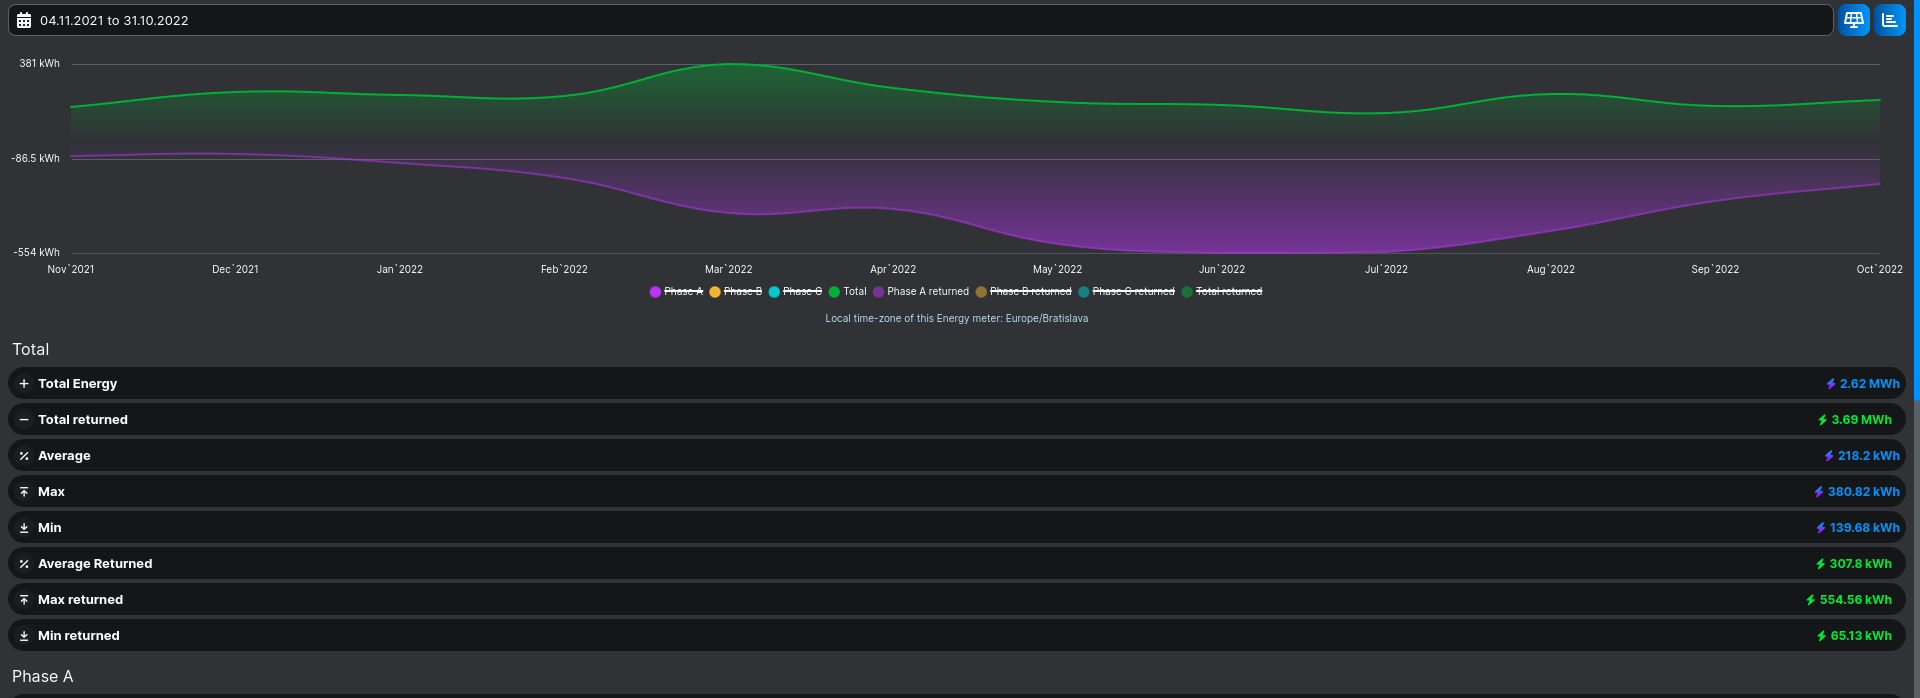
2021/2022
| year | month | production in kWh |
| 2021 | november | 74.96 |
| december | 64.68 | |
| 2022 | january | 107.51 |
| february | 183.88 | |
| march | 354.66 | |
| april | 336.2 | |
| may | 511.16 | |
| june | 553.89 | |
| july | 546.84 | |
| august | 446.8 | |
| september | 297.41 | |
| october | 211.32 | |
| november | 80.55 | |
| december | 51.89 | |
| 2023 | january | 68.1 |
| february | 170.3 | |
| march | 287.61 | |
| april | 303.47 | |
| may | 412.48 | |
| june | 451.97 | |
| july | 502.48 | |
| august | 441.19 | |
| september | 327.62 | |
| october | 201.75 | |
| november | 94.46 | |
| december | 63.87 | |
| 2024 | january | 113.8 |
| february | 139.06 | |
| march | 255.68 | |
| april | 402.25 | |
| may | 509.5 | |
| june | 458.17 | |
| july | 540.31 | |
| august | 466.75 | |
| september | 279.13 | |
| october | 184.47 |
RELATED POSTS
View all
Leave a Reply